World Is Burning Less
By Ken Gregory, August 30, 2026
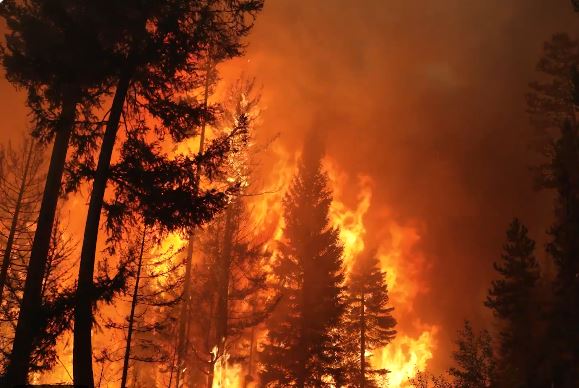
Bjorn Lomborg[i] recently issued a newsletter that shows global wildfire burned area is burning less than ever before, despite wildfires dominating headlines in recent weeks.
Devastating fires in Europe and Canada have been presented by the media as evidence of an escalation climate crisis. Lomborg wrote “But climate change is a global issue, so it should be assessed using global data. Pointing to horrific fires in one corner of one continent while ignoring a planet that burns phenomenally less is the very definition of cherry picking: keep the observations that fit the story, throw away the rest.”
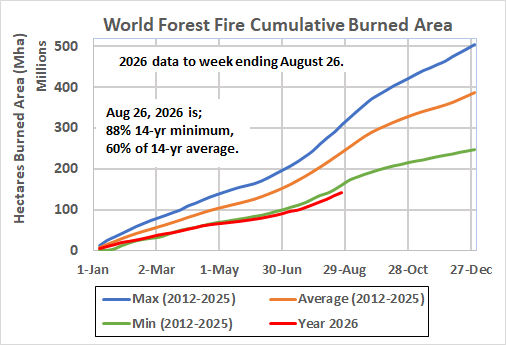
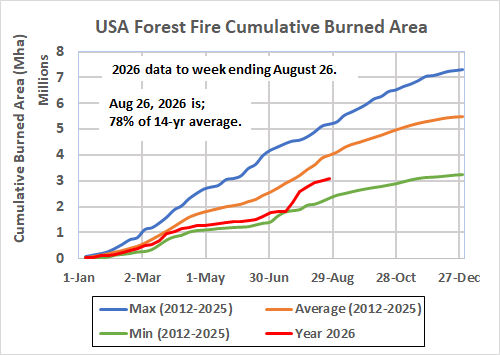
The newsletter presents a graph of the global wildfire cumulative burned area as of August 19, 2026, along with years 2012 – 2025. Lomborg wrote “By August 19, the global burned area was 41% below normal, and all continents were below average, with Africa, North America, and South America at record lows.” A Washington Post article by Lomborg dated August 12 stated that in Canada by July 9, “1.4 million hectares burned—less than a third of the 4.6 million hectares burned by the same date last year.” It also said “Satellite data weekly updated by the European Union confirm that Canada’s total burned area in 2026 by Aug. 5 was below the 2012-25 average the EU uses as a baseline. And the statistical good news keeps coming. The U.S. this year has remained below its 2012-25 average, with its most recent measurement 20% below average as of Aug. 5. North America and South America are at a record-low burn since 2012.” Every continent is burning less.”
However, on X.com, Kyle Brittain, a fact checker, challenged Lomborg’s findings. Brittain wrote “The latest data actually show that YTD total wildfires and area burned are above average in both countries. As of August 13, total/10-year average;
Canada Area burned: 4,109,003 ha/3,554,355 ha (116%)
USA Area burned: 6,485,336 (154%)”
So why are Lomborg and Brittain presenting vastly different current and historical average burned areas? The answer is that they are using different data sources that were built for different purposes. They have different mapping methodologies, and definitions of what constitutes a “burned perimeter”.
Lomberg is using the Global Wildfire Information System (GWIS) operated by the European Union which is based on satellite data. The GWIS uses global algorithms processing near real-time satellite thermal data. Only grid cells that exhibit thermal signatures or clear spectral burn marks are included. Unburned patches inside a perimeter do not register as burned area.
For Canada’s data, Brittain is using Canadian Wildland Fire Information System (CWFIS) which collects administrative reports from provincial, territorial, and federal fire management agencies. These agencies construct perimeters using direct operational inputs: high-resolution aerial mapping and local ground surveys. During active fire seasons, operational agencies draw a boundary or polygon around an entire active fire zone to define management boundaries. This “outer perimeter” often includes substantial unburned pockets/islands (lakes, swamps, rocky ridges, or unburned stand patches inside the overall fire boundary). CWFIS agency figures represent this gross operational area. After the fire season, spectral burn-severity mapping is used to report the net burned area that removes the unburned patches. The net burned is reported by Canada’s National Burned Area Composite (NBAC).
Thus, GWIS inherently measures a lower net burned footprint, whereas early-season CWFIS agency figures report a higher gross polygon size. So, the numbers that Brittain quoted are not really burned areas, they are fire management areas including significant unburned areas.
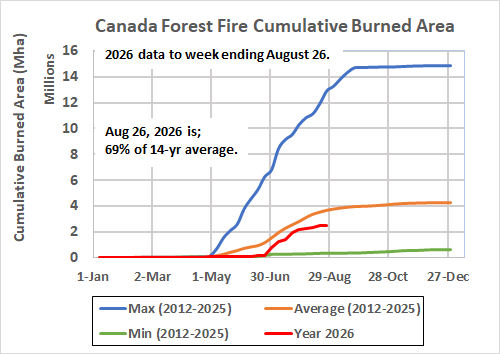
The CWFIS reports for August 26, 2026, the cumulative gross burned area (with unburned patches) was 4.43 million ha and the corresponding 10-year average was 4.11 million ha. The GWIS reports Canada’s burned area as of August 26, 2006 was 2.52 million ha and the 14-year average (2012-2025) was 3.65 million ha.
The NBAC reports the full-years 2024 and 2025 burned areas in Canada as 4.92 million ha and 7.31 million ha, respectively. For comparison, the CWFIS reports 5.05 million ha for all 2024 and 9.01 million for all 2025. The GWIS reports the 2024 and 2025 burned areas as in Canada as 5.15 million ha and 7.37 million ha, respectively.
These three data sets are compared in the following table.
| Canada’s Wildfire Full-Year Burned Area by Three Datasets (Million ha) | |||
| Year \ Dataset | CWFIS | NBAC | GWIS |
| 2024 | 5.05 | 4.92 | 5.15 |
| 2025 | 9.01 | 7.31 | 7.37 |
The table shows that the CWFIS data for 2025 is significantly greater than the two datasets, NBAC and GWIS, which are intended to show only burned areas and their numbers are similar. However, for 2024, the final CWFIS area is only 2.6% greater than NBAC. Final year NBAC values are usually significantly less than final year CWFIS, but by the end of the year, GWIS can ends up higher than NBAC/CWFIS, as in 2024, because satellite algorithms over-count spatial pixels and capture late-season smoldering/agricultural fires that post-season spectral filtering (NBAC) cleans out.
The following graphs show the cumulative burned area as of August 26 using the GWIS satellite-based data for the World, Canada, and USA. The data confirms that Lomborg correctly states that the World is burning less.
[i] As a researcher and writer, Bjorn Lomborg is dedicated to identifying the smartest solutions for global challenges. Serving as president of the Copenhagen Consensus Center, he has worked with hundreds of top economists to prioritize the most cost-effective ways to create meaningful change.
Thank you, Ken. That is an important explanation.