Contributed by Robert Lyman © 2025. Robert Lyman’s bio can be read here.
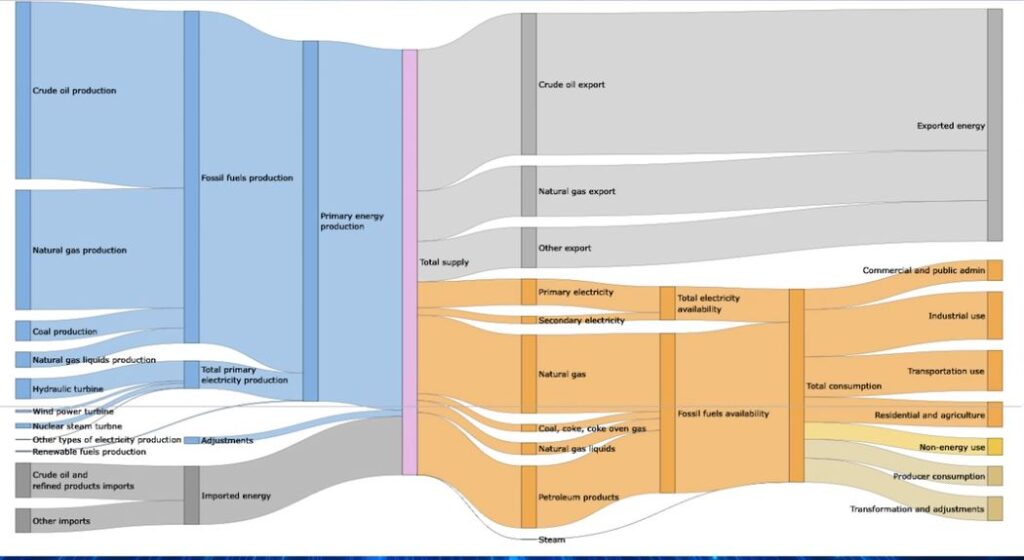
A Sankey diagram is a visualization used to represent flows and quantities between different stages or categories. It is characterized by bands whose widths are proportional to the “flow” rate, making it easy to see the magnitude of different flows. Sankey diagrams are designed to be read from left to right. The flow components are referred to as ribbons or pipes.
These diagrams are particularly useful for visualizing energy flow, material flow, or any process with multiple stages and significant movement among them. The Canadian Centre for Energy Information has produced Sankey diagrams to depict Canadian energy flows. The diagram for 2023 can be found here.
The terminology used in the diagrams is different from that familiar to those who monitor Canadian energy market trends and energy policy issues. For example, the “Canadian energy flow” depicts, from left to right, total energy supply broken down in terms of domestic production and imports and by energy source, flowing on the right to total energy uses broken down in terms of exports and “total consumption” (i.e. total energy consumption in Canada) in totals and by energy source.
While the Sankey Diagram published by the Canadian Centre for Energy Information does not include the data upon which it is based, this can be found in the reports of the Canadian Energy Regulator.
I have used these to produce the following two tables.
Total Canadian Energy Supply in 2023 (Petajoules)
| Domestic Production | Quantity |
| Crude oil | 11.275 |
| Natural Gas | 7.626 |
| Coal | 1.269 |
| Natural Gas Liquids | 0.972 |
| Hydraulic Turbine (hydroelectricity) | 1.280 |
| Wind | 0.144 |
| Nuclear | 0.302 |
| Other types of electricity plus renewables | 0.076 |
| Total Domestic Production | 22.950 |
| Imports | |
| Crude oil and refined oil products | 2.201 |
| Other | 1.519 |
| Total Imports | 3.720 |
| Total Supply | 27.079 |
Total Use of Canadian Energy in 2023 (Petajoules)
| Use By Energy Source | Quantity |
| Electricity | 2.182 |
| Natural gas | 4.998 |
| Coal and Coke | 0.452 |
| Natural Gas Liquids | 0.757 |
| Petroleum products | 3.963 |
| (Fossil fuels) | 10.170 |
| Total Domestic Consumption | 12.298 |
| Exports | Quantity |
| Crude oil | 9.013 |
| Natural Gas | 3.197 |
| Others | 2.571 |
| Total Exports | 14.781 |
| Total Energy Use | 27.079 |
Comments
The portrayal of Canadian energy sources and uses this way offers some insights that are different from those generally conveyed in public and media discussions.
Canada exports more energy than it uses.
This is especially the case with crude oil, where 80 per cent of production is exported. This has been the case for several years. It is also perhaps striking that 42 per cent of natural gas production is exported. These points indicate the importance that oil and natural gas exports have as earners of foreign exchange. If, as proposed by current Canadian climate policy, a cap is placed on oil and gas production and increased in severity over time, it would inevitably reduce exports and affect export customers as well as Canadian industry earnings and government tax and royalty revenues.
Canada’s energy imports are important but small compared to total domestic production.
Canada’s total energy imports of 3.720 PJ are only 14 per cent of total energy sources. Almost all regions of Canada import some energy, not necessarily because of physical shortages but because it makes economic sense for them to do so.
Fossil fuels constitute 93 per cent of domestic energy supply.
For all the publicity given to the alleged electrification of Canada, domestic electricity and renewables production provides only seven per cent of our energy production.
Fossil fuels also meet by far most of Canada’s energy consumption needs.
Electricity meets only 18 per cent of Canada’s energy demand, slightly below the average in most other OECD countries.
Coal production remains important.
In energy terms, coal production is roughly equal to hydro-electricity, which gets far more attention and government endorsement. Coal produces almost nine times as much energy as Canadian wind turbines.
Surprisingly, the combined residential and agriculture sectors account for a significant share of Canadian domestic energy demand.
It is not a surprise that the transportation accounts for the second largest share of domestic energy demand. The costs of efforts to reduce energy demand and emissions in homes and farms get too little attention.
Consumption of energy by energy producers is surprisingly low.
Production consumption (i.e. the amount of energy used by producers to make their products) is only 1.126 PJ, or 9.2 per cent of domestic energy consumption. Yet this is the only sector that has been singled out by the federal government for a specific GHG emissions cap.
View our video “Insights from a Sankey Diagram“.
Leave a Reply! Please be courteous and respectful; profanity will not be tolerated.