Contributed by Robert Lyman © 2025. Robert Lyman’s bio can be read here.
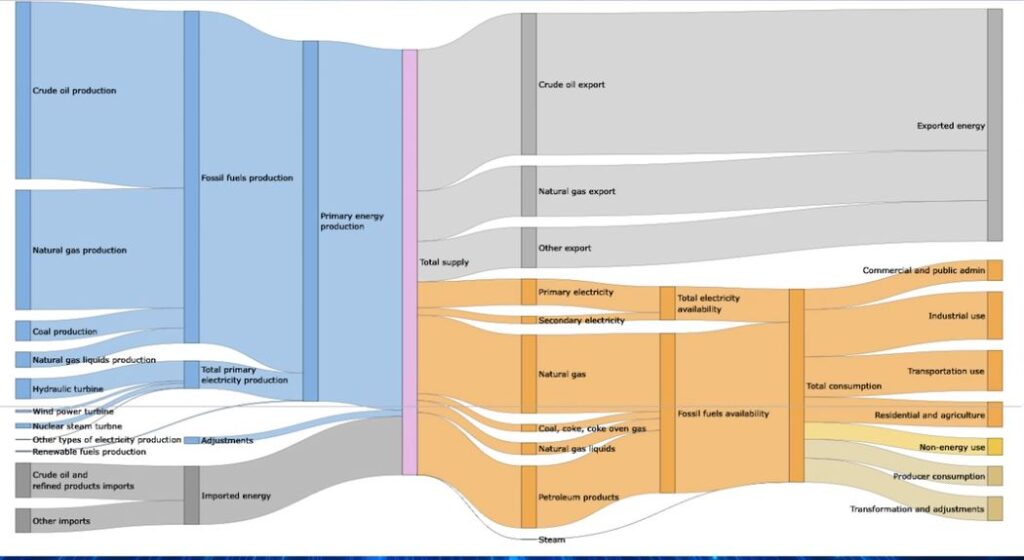
A Sankey diagram is a visualization used to represent flows and quantities between different stages or … Continue reading
Contributed by Robert Lyman © 2025. Robert Lyman’s bio can be read here.
A Sankey diagram is a visualization used to represent flows and quantities between different stages or … Continue reading

This explainer video walks through the key points of the executive summary of a Robert Lyman report “Global Energy Demand” which offers highlights from the 2025 Statistical Review of World … Continue reading

Licensed from Adobe Stock
Contributed by Robert Lyman © 2025. Robert Lyman’s bio can be read here.
On June 26, 2025 the Energy Institute published the latest … Continue reading

Contributed by Ronald Stein, P.E., advisor on energy for the Heartland Institute and CFACT.
First published at America Out Loud News
California is home to 9 International airports, 41 … Continue reading

Contributed by Robert Lyman © 2025. Robert Lyman’s bio can be read here.
On January 30, 2025 Bloomberg NEF issued its … Continue reading
With Samuel Furfari
This is a Google translated version of the French original, of Jan. 8, 2020, republished with permission of the author. ©2020

The start of the … Continue reading
Contributed by Robert Lyman © 2017
Robert Lyman is an Ottawa energy policy consultant who has 27 years experience as a public servant and 10 years experience as a diplomat.… Continue reading
Contributed by Robert Lyman © 2017
Robert Lyman is an Ottawa energy policy consultant who was a public servant for 27 years and a diplomat for 10 years.
Many people, … Continue reading
Contributed by Robert Lyman © 2017
It’s tough to make predictions, especially about the future.”
(Yogi Berra)
The purpose of this note is briefly to summarize two alternative views about … Continue reading