Contributed by Robert Lyman © 2022. Robert Lyman’s bio can be read here.
The British Petroleum Statistical Review of World Energy for over seventy years has been the most authoritative source of data available to the general public concerning global energy market trends. The review has changed its focus and contents somewhat over the years, and continues to do so. For the last twenty years, it has included data on carbon dioxide emissions. The latest version, the 2022 Review, continues the tradition of authoritative content and change. This year, it has dropped the sections that report on hydrocarbons reserves, but added sections on the minerals needed to produce batteries.


For many people reading reports dealing mostly with numbers is an ideal cure for insomnia, or at least an exercise in boredom from which they derive few insights. With that in mind, I propose to summarize the highlights of this year’s review in terms of whether or not they support or contradict the common media perceptions concerning climate change and the alleged energy transition. I will state the common perception and then indicate whether the new data confirm or contradict it.
Perception 1: The world is reducing its energy consumption
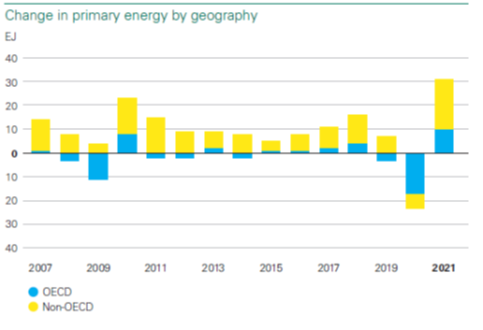
Data summary: Primary consumption of all energy sources declined by 23 exajoules (4%) from 2020 to 2021 as a result of the direct and indirect effects of the COVID-19 pandemic. In 2021, however, it bounced back by 31 exajoules (5.8%) to 595 exajoules.
Over the period 2011 to 2021 inclusive, primary energy consumption has increased by 14%.
Verdict: The world is increasing its energy consumption due to increased economic activity and the gradual ending of the pandemic. The perception is wrong.


Perception 2: Renewable energy (wind, solar and biomass) are fast increasing their share of global energy consumption.
Data summary: The world consumption of renewable energy increased by 15% in 2021, continuing a pattern of growth that has continued for over a decade. By 2021, however, renewable energy accounted for only 6.7% of primary energy consumption (mostly biomass), while hydrocarbons (oil, natural gas and coal) accounted for 82.3%.
Governments and industry spent $750 billion on “clean energy” in 2021, and over $3.7 trillion on clean energy from 2011 to 2018. The share of total energy consumption held by hydrocarbons has declined from 86% to 82% as a result.
Verdict: Global consumption of renewable energy is fast increasing in percentage terms , but renewables’ share of global energy consumption is rising very slowly. The perception is partly right.

Perception 3: Carbon dioxide emissions from energy use are declining.
Data summary: Carbon dioxide emissions from energy use were 31.9 billion tonnes in 2011 and 33.9 billion tonnes in 2021, an increase of 6%. They declined by two billion tonnes in 2020 and almost recovered to their 2019 level in 2021.
Verdict: Global carbon dioxide emissions are slowly increasing, probably at the rate of one to two percent annually. The perception is wrong.

Perception 4: To attain the UN global emission reduction targets, the richer countries of the OECD must bear the largest share of the task of reducing global carbon dioxide emissions.
Data summary: In 2021, the OECD countries produced 33.3% of global emissions from energy use, while the non-OECD countries produced 66.7%.
From 2011 to 2021, emissions in the OECD countries declined by 14%, while those from the non-OECD increased by 19%. The decline by the OECD totaled 1.55 billion tonnes and the increase by the non-OECD totaled 3.53 billion tonnes, more than twice as much.
China’s emissions in 2021 were 10.5 billion tonnes, or 31% of the world total. The United States has the highest emissions of any OECD country, and they were 4.7 billion tonnes in 2021, or 14% of the world total. The countries of the Asia-Pacific region produce over 52% of the world’s energy-related emissions.
The non-OECD countries are by far the largest source of emissions and the fastest growing source. If the countries of the OECD somehow ceased to produce any emissions immediately (impossible), the world’s emissions in 2021 would still have totaled 22.6 billion tonnes.
Verdict: The perception is wrong.
Perception 5: Oil consumption is declining due to the introduction of electric vehicles.
Data summary: In 2021, oil consumption grew by 5.5 million barrels per day to 96.9 million barrels per day. This was a recovery from a COVID-related decline of 9.2 million barrels per day in 2020.
Over the period 2011 to 2019, oil demand grew by over 21 million barrels per day.
World oil demand still has not fully recovered to its pre-pandemic levels.
Verdict: There is no indication that EV sales are in any way reducing world oil demand. The perception is wrong. (See also Robert Lyman’s earlier commentary from 2017, offering some insight on the numbers involved.)

Perception 6: Natural gas consumption is declining.
Data summary: Global consumption of natural gas was 116 exajoules in 2011, 138 exajoules in 2020 and 145.35 exajoules in 2021, From 2011 to 2021, natural gas consumption rose by almost 29 exajoules.
Verdict: Natural gas is the world’s fastest growing source of primary energy, rising faster than renewables, despite the massive pub subsidization of renewables. The perception is wrong.

Perception 6: Coal consumption is definitely and permanently declining.
Data summary: In 2021, global coal consumption totaled 160 exajoules, an increase of 9 exajoules from 2020. Coal consumption is virtually unchanged from a decade ago.
The combined coal consumption of China and India is 106 exajoules, or 66% of the world total. Coal consumption increased in both North America and Europe in 2021.
Verdict: Global coal demand is slowly rising. The perception is wrong.

Perception 7: Complete decarbonization of global electricity generation is attainable by 2050.
Data Summary: Global electricity generation totaled 28,466 terawatt hours in 2021. Of that total, renewables constituted 3,657 TWh, or 13%.
Coal remained the dominant fuel for power generation in 2021, with its share increasing to 36%, up from 35.1% in 2020.
Adding the shares produced by nuclear energy (2,800 TWh), hydroelectric generation (4,274 TWh) and others (252 TWh), non-hydrocarbons power generation was 10,983 TWh, or 39% of the total. The prospects for significant additions to nuclear and hydro sources are poor.
Complete decarbonization would thus require mostly renewable energy to replace 61% of current generation. Roughly 900 TWh of new renewables-based generation would have to be added, and existing hydrocarbons-based generation displaced, every year from now to 2050. 900 TWH is about one quarter of present European power generation.
Verdict: Complete decarbonation of the global electricity system will not happen by 2050. The perception in wrong.
Conclusion:
Most of the perceptions that underpin the claims of those who project rapid decarbonization of the world economy by 2050 are wrong, based on the actual trends in global energy markets over the past decade. It is important that these facts be injected in public discussion of climate policy and government expenditures.


It seems you are excluding hydropower from the list of renewables, Robert?
“Perception 2: Renewable energy (wind, solar and biomass) are fast increasing their share of global energy consumption.”
Why? The environmentalists do seem to reject it as having too much environmental impact? I’m wondering when they will become concerned with the environmental impacts of solar and wind?
Duane, I used the same energy categories used by the BP Statistical Review, which includes in “renewables” only wind, solar and biomass energy. I agree that Hydro power is renewable in the traditional sense of the term.
Robert, this is an excellent summary.
The prices of Japan LNG and Japan Korea Marker (LNG) track closely from from 2011 to 2018, the Japan LNG price is significantly higher than the Japan Korea Marker by $4.5 in 2019 and $3.4 in 2020. In 2021 the Japan Korea Marker price is higher by $8.1/million Btu. I would think the prices taken very close to each other would always track closely.
The UK and Netherlands gas price in 2021 are almost the same, $15.8 and $16.0, but the German price is $8.94, or $7 less. Wow. How is that possible?
Ken’ I do not follow global LNG markets closely. Given the supply problems now faced by Germany, I do not understand why the spot price of LNG to that market would be lower than the prices to other European markets. Here is an interesting article: https://www.reuters.com/article/global-lng-idUSL1N2YB0OQ