Contributed by Michael N. Chernoff, BSc. Geological Engineering © May 31, 2021
96 percent of the earth’s species were extinguished at the close of the Permian period (252 million years ago -MYA). The extinction interval is fairly short (thousands of years) and recovery began within a few million years of extinction.

Figure 1 shows the earth’s extinction occurrences in the last 600 MY. It is interesting to note that the extinctions are not random but have periodicity. In this case, we recognize cycles of 256, 171, 64, 39 and 28 million years.
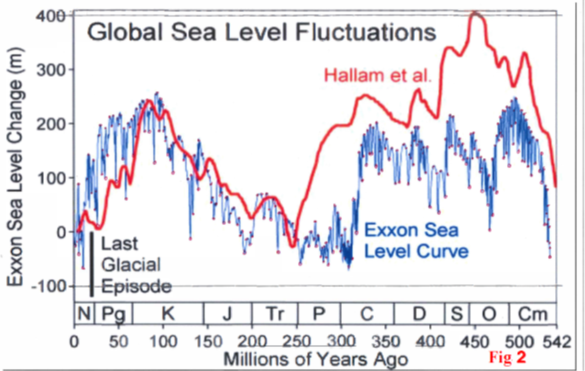
Figure 2 is the Exxon sea level curve derived from their study of world wide seismic data. Again, the rise and fall of sea levels are not random and in this case we recognize cycles of 128, 62 and 30 million years.

Figure 3 is a graph of the global carbon dioxide (CO2) and temperature curves for the last 600 MY. The end of Permian extinction occurred at the close of a long period of very low CO2 and temperature values during deep global cooling associated with an ice age.

Figure 4 provides some of the explanations for the extinction event. The published record has produced opposing arguments of both global cooling and global warming – a wide spectrum indeed. A quick search of the internet will produce other proposed causes. The latest 2018 reported research concluded that global warming was the main cause of extinction.

I will now propose the most realistic cause of the extinction. Figure 5 shows atmospheric concentration of CO2 and O2 (oxygen) during the last 550 MY. Let’s review the curves and identify the events that caused to curves to rise and fall. Approximately 400 MYA, CO2 concentration was close to 3000 ppm and
by the end of the Devonian CO2 was less than 300 ppm. The decline in CO2 was due to photosynthesis within a rapidly evolving range of land plants (gymnosperms). Photosynthesis is a natural process whereby CO2, water and sunlight combine to produce glucose and oxygen. Coincidentally a significant
rise in O2 occurred during Carboniferous and Permian times due to photosynthesis of vigorous forest growth. Note the decline of O2 in Devonian time. I attribute O2 depletion due to widespread deposition of “red beds” known as Old Red Sandstones (ORS). The dissolved iron in the oceans was oxidized and the red oxides coated the sandstone grains that were deposited. The following high O2 period buildup occurred after ORS deposition. Note that near the end of the Permian and Triassic O2 was again depleted, this time, by extensive deposition of “red beds” known as New Red Sandstone (NRS).
During late Carboniferous and Permian time atmospheric content of CO2 hit rock bottom at less than 300 ppm. This was also a period of cyclical ice ages with global glaciation. Fig. 3 shows that during this period temperature, also, was at historic lows. The cold oceans sequestered additional CO2 from the atmosphere stressing all plants, marine and land, a tipping point was reached where the plants died, the
food chain collapsed and 96% of earth’s species became extinct. Currently researchers have indicated that extinction was due to global warming (high temperature and high CO2). However, if we examine the extinction event closely, we see that high temperatures and high CO2 persisted throughout the
Triassic when life came back within 2 MY of the extinction event. Fig. 6 is a timeline for the extinction event and recovery. If global warming and high CO2 was a killer, how come life recovered and thrived during and an extended period of warm temperatures and high CO2 starting in early Triassic time?

If we examine Fig. 3 closely, it is obvious that the current status of temperature and CO2 is very similar to the end of Permian time and the extinction event; therefore, we are vulnerable to the same demise.
During the Pleistocene (last 2 million years) we saw CO2 go as low as 180 ppm, a level dangerously close to plant extinction. Currently the IPCC and NGO’s are using pre-industrial time as the reference point for a desirable level of CO2 (280 ppm). They consider any level of CO2 higher than that as anthropogenic
and therefore undesirable. In other words, pre-industrial time represents optimum climate and that is what we should strive for. But pre-industrial time was the worst of times. Climate was dominated by the Little Ice Age (LIA), crops were failing, starvation and pandemics were rampant. I contend that civilization dodged a bullet during the LIA because we were very close to the tipping point reminiscent of the end of Permian extinction. We are fortunate that CO2 levels are rising, fertilizing our crops and forests and greening our planet. As Fig. 3 demonstrates our current status and end of Permian represent the lowest levels of temperature and CO2 in the last 600 MY. To consider reducing atmospheric CO2 at this time is sheer insanity. To provide a margin of comfort we require more CO2 not less.
GLACIAL CYCLES
We should recognize the contribution that ice-house cycles have made to extinctions, temperatures and CO2. The end of Permian extinction and the current Pleistocene/Quaternary period are examples of very deep glacial cycles. The Carboniferous-Permian ice-houses ended with global extinction of both marine and land species. Our current situation makes us vulnerable to a similar
extinction event.
The study of ice cores taken from Arctic and Antarctic drill sites on thick glaciers shows regular temperature and CO2 cycles at 100,000, 41,000, and 25,000 years. These are the Milankovitch cycles which produce both glacial and interglacial climates. It should be noted that although the temperature and CO2 cycles appear to be rising and falling in tandem, the CO2 curve LAGS the temperature curve by
anywhere from 400 to 1600 years. The different lag intervals are derived from different unique single cycles. The inconvenience of the CO2 lag is a problem for the IPCC which has made CO2 the main driver of temperature. The IPCC stance is contrary to the empirical data. This repetitive inconvenience has not deterred the IPCC and they continue to promote CO2 as the driver and undesirable pollutant.
However, the geological history of the planet shows that the Milankovitch cycles have not, on their own, produced the ice-house or glacial events. To produce an ice-house event the Milankovitch cycles must overlay other cycles with periods of millions of years. We have shown that extinction events and sea
level curves indicate cycles of approximately 60 and 30 MY. The deep ice-house cycles have periods of approximately 150 million years. Whereas the Milankovitch cycles are generated within the solar system, the longer million-year events correlate with galactic events. For example, the 60/30 MY cycles
are a result of the solar system “bouncing” vertically above and below the galactic disk. The longer 150 MY cycle is an artifact of the solar system’s journey around the galactic center (one complete cycle is approximately 250 MY). It is important to note that the end of Permian extinction and today are approximately 250 MY apart; therefore the solar system currently occupies the same position in the
galaxy as it did during the great extinction. The journey of the solar system through the galactic disk produces a variable intensity of exposure to interstellar dust, comets and cosmic rays which bombard the planet and influence the climate. CO2 does not play a role in either the formation of an ice-house or its disappearance. Fig. 7 shows the cumulative effect of the solar system’s motion in the galaxy. The effects bottom out at 450, 270, 140 and 2 MY which conveniently correlate with the Ordovician, Permo_Carboniferous, Jurassic and Pleistocene cool periods. During these periods the Milankovitch cycles forced a further reckoning and major glacial cycles occurred.

The thick black line on the graph is Wickson’s (2007) interpretation of the effect of the motion. The thin horizontal black line would represent the center of the galactic disk (MNC).
RELATED:
Tertiary Hyperthermal Events: Precursors of the Current Situation?
Regarding carbon, most competent scientists agree that CO2 levels during the dinosaur days (200 – 65 million years ago) was at least 4 times higher than now – and life continued normally. I don’t see mention of this major element in your discussion.
Your discussion should also include reference to the catastrophic event about 65 million years ago of a large asteroid impacting the earth at the Yucatan region of Mexico that caused the extinction of most life above ground including the dinasaurs.
– Richard Penner, Saskatoon
1. Fig. 3 shows the high CO2 that you refer to. I agree, life thrived through those warmer years with high CO2. We can adapt to globally warming; however, we are doomed if the food chain is broken by extinction of plants due to low CO2.
2. Fig. 1 shows the extinction at end Cretaceous. I consider it a random event and not a cyclic event forced by Milankovich cycles superimposed on events resulting from our journey through the galaxy.
Very refreshing to read an article with a geological view of the earth’s history. Thank heavens for CO2 – more is better.