Contributed by Donald Morton © 2018
Donald Morton is a retired astrophysicist whose career included being a rocket scientist at Princeton University, Director of the Anglo Australian Observatory and Director General of the Herzberg Institute of Astrophysics at Canada’s National Research Council.
ABSTRACT[1]

In this essay I would like to explore some basic issues in the controversial topic of climate change. Specifically, these are 1) scientific principles, 2) natural and anthropogenic contributions, 3) backwarming by atmospheric carbon dioxide, 4) climate models, 5) benefits of a warming planet and increasing carbon dioxide, 6) other ecological and health problems, 7) family size, 8) uninterruptable and inexpensive electricity, 9) biofuels and 10) rising sea level. My ultimate conclusions are to generate more electricity with nuclear energy and emphasize adaptation where needed rather than expending resources in the hope of mitigating a global warming that could be dominated by natural effects.
LINK to PDF of complete essay: ClimateEssay
1. SCIENTIFIC PRINCIPLES.
The scientific method has delivered uncountable benefits worldwide through our understanding of how nature works leading to new technologies, often aided by the availability of abundant energy. The essential feature of the scientific method is to develop a mathematical theory or model to explain some phenomenon and then make predictions of other phenomena to establish the validity of the model. As successful predictions accumulate, confidence in the model increases, while failed predictions indicate that the model must be revised or rejected.
According to Popper (1935, 1959), acceptable scientific theories can be falsified by observations, but never established beyond question. Instead, we just obtain a better understanding of the limits of validity of a particular theory. For example, future research very likely will change our theories and understanding of turbulence, but already flight and wind tunnel experiments have given us confidence in the safety of aeroplanes. In other cases, as noted by Kuhn (1962), a paradigm change occurs, as from Newtonian gravity to Einstein’s General Relativity, demonstrating that we never can say the science is settled.
Since science is based on observations confirming predictions, we must recognize that any consensus among scientists about a particular issue proves nothing. Before the Michelson-Morley experiment in 1887, there was a consensus among most physicists that all space required a substance called the aether to transmit light waves. Prior to 1984, when two Australian doctors demonstrated that the bacterium Heliobacter pylori caused gastric ulcers, there was a consensus that blamed anxiety. Similarly, recent research has challenged the consensus that linked heart disease and cholesterol consumption.
Also central to the scientific method is the full publication of the methods and data used to reach a particular conclusion. Otherwise there can be no independent check on a scientific claim. Even the most careful and scrupulous of scientists can make mistakes or have unrecognized biases. The publication of the Climategate emails revealed a determined rejection of this fundamental principle.
“…We have 25 or so years invested in the work. Why should I make the data available to you, when your aim is to try to find something wrong with it…”
—Dr. Phil Jones, Director of the Climate Research Unit at East Anglia University,
email to Warwick Hughes, 2004,
and
“I’m getting hassled by a couple of people to release the CRU station temperature data. Don’t any of you three tell anybody that the UK has a Freedom of Information Act.”
—Dr. Phil Jones, Director of the Climatic Research Unit,
disclosed Climategate e-mail, Feb. 21, 2005.
Lack of information about the tuning (calibration) of climate models is another important example. As described by Voosen (2016) “For years, climate scientists had been mum in public about their ‘secret sauce’: What happened in the models stayed in the models. The taboo reflected fears that climate contrarians would use the practice of tuning to seed doubt about models—and, by extension, the reality of human-driven warming. … Indeed, whether climate scientists like to admit it or not, nearly every model has been calibrated precisely to the 20th century climate records—otherwise it would have ended up in the trash.” If we do not know the assumptions that went into the calibration of a climate model, how can we validate it and trust its predictions?
Another aspect of the scientific method is the careful and consistent use of definitions. Thus, any discussion of climate should begin by stating the time scale needed to distinguish between climate and weather and defining the term climate change. A rise in global temperatures beginning about 1975 led to concerns about the effects of human-generated carbon dioxide (CO2), the formation of the Advisory Group on Greenhouse Gases in 1985 and the establishment of the Intergovernmental Panel on Climate Change (IPCC) in 1988. However, after temperatures stopped rising in the early 21st century, it was clear an interval longer than 10 years was needed to average out the random effects of weather, so now the World Meteorological Society recommends 30 years. Furthermore, we must be careful using the term climate change. Is it the sum of all natural and anthropogenic effects or just the human contributions? Our climate always has been changing naturally so it is essential to state which is being discussed.
Also, the term greenhouse gas for CO2, methane (CH4), nitrous oxide (N2O) and certain chlorofluorohydrocarbons is very misleading. Greenhouses become hot by preventing the interior air heated by the sunlight absorbed by the plants from mixing with outside air, not by absorption by the glass enclosure. The only connection between CO2 and greenhouses is the addition of CO2 to about 1000 parts per million to enhance the growth of the plants inside. A more appropriate name for the infrared radiative backwarming by our atmosphere would be the Arrhenius Effect in recognition of Svante Arrhenius (1896, 1906) for his calculations of the global heating due to CO2. Similarly designating CO2 as a pollutant, when that gas is essential for life on Earth, is an unscientific label.
As well we should avoid the misleading term “ocean acidification”, which leaves the impression it is used to raise alarm. The present pH range of 8.4 to 7.8 in the oceans is decreasing at a rate between 0.13 to 0.24 per century (IPCC2013 p 3.8.2) so adding CO2 is shifting the oceans towards the neutral pH of 7.0 making them less reactive. In a few centuries this might be a problem for some organisms, but not because of a reaction with acidic water.
Finally, scientists should welcome challenges to their results and recognize that often useful criticism can come from someone working in a different discipline. Convincing responses to challenges, as well as independent reproduction of initial results, help build confidence in theories and models. Science progresses by the persistent questioning of every measurement, every theory and every model.
2. NATURAL AND ANTHROPOGENIC CONTRIBUTIONS TO CLIMATE CHANGE.
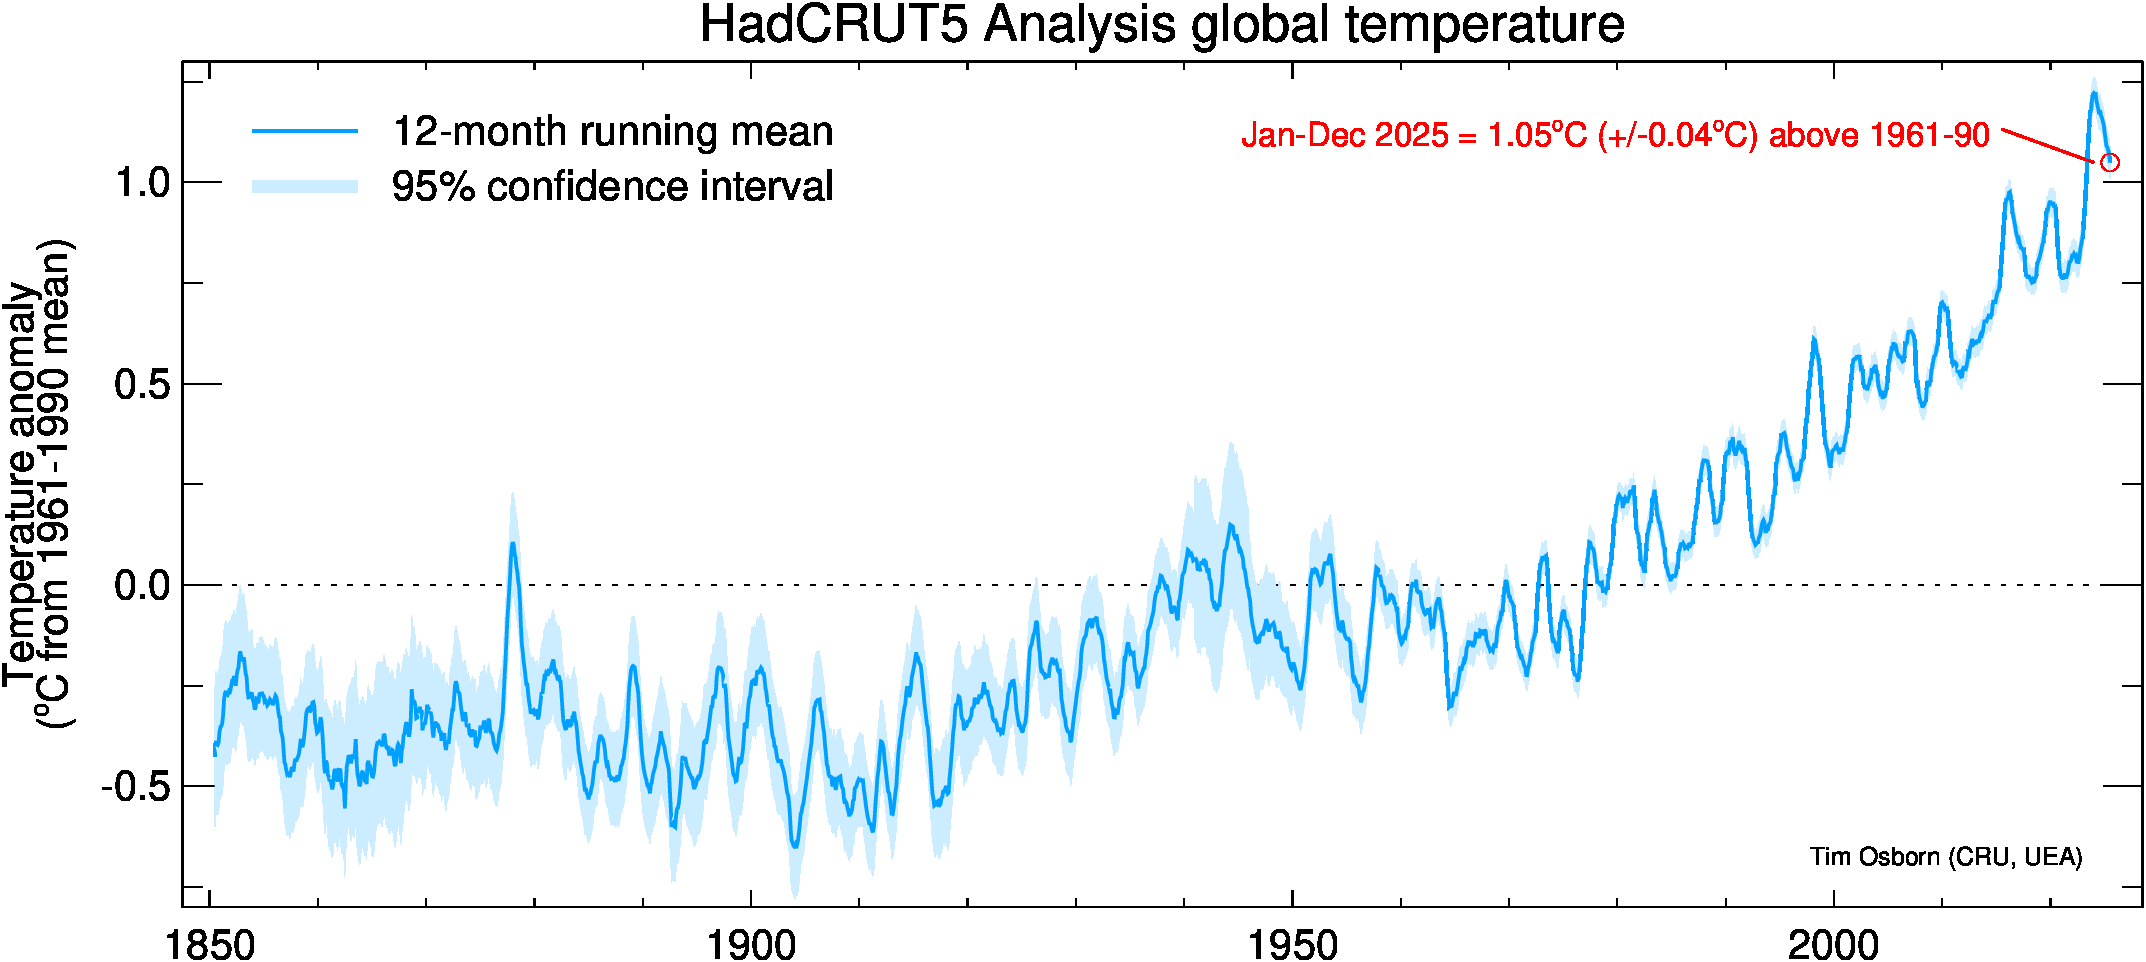
In spite of temperature being an intensive thermodynamic variable, so any average has no physical meaning for any system outside of thermodynamic equilibrium, climatologists find it useful to calculate the temperature anomaly for a site, the difference with respect to some long-term average for the same time of day and then average over the whole earth, with extrapolations for regions with no measurements. There is no scientific basis for believing that a time series of this single statistic, which happens to be in temperature units, can represent the evolution of the whole earth, which certainly is not in equilibrium. See for example the discussions by Essex and McKitrick (2007) and Essex, McKitrick and Andresen (2007). Nevertheless, the IPCC uses curves such as Fig. 1 to illustrate a gradually rising global temperature and the consequences of increasing atmospheric CO2, which is plotted in Fig. 2. Prior to the Mauna Loa data, which began in 1958, we have measurements from ice cores from the Antarctic Law Dome (Etheridge et al. 2001) indicating a rise from 291 ppm in 1880 to 334 ppm in 1978, overlapping well with the direct measurements. The relevant CO2 infrared absorption bands are strongly saturated so they contribute in proportion to the logarithm of the concentration.
The rise in the temperature anomaly from 1975 to 2001 did occur while the CO2 concentration increased from 331 to 371 parts per million by volume (ppm) (ln 371/331 = 0.114), but the comparable rise from 1910 to 1945 happened during a much smaller change of 300 to 310 ppm (ln 310/300 = 0.0033) in atmospheric CO2. Furthermore, CO2 does not account for the slightly decreasing temperatures from 1945 to 1975 nor the level interval from 2001 to the beginning of the strong natural El Nino event of 2016.

Fig. 1. The global annual average near-surface temperature anomalies since 1850 from the United Kingdom Climate Research Unit at the University of East Anglia (https://crudata.uea.ac.uk/~timo/diag/tempts_12monrunning_global.png ). The 1998 and 2016 spikes are due to the natural El Nino warming of the Pacific Ocean.

Fig. 2. History of atmospheric concentration of CO2 above Mauna Loa, Hawaii. The annual oscillations result from the increasing growth of vegetation during spring and summer in the Northern Hemisphere. (www.http://scrippsco2.ucsd.edu/graphics_gallery/mauna_loa_record/mauna_loa_record ),
(ftp://ftp.ncdc.noaa.gov/pub/data/paleo/icecore/antarctica/law/law_co2.txt ).
If any conclusion can be taken from Fig. 1 and 2, it must be that effects other than CO2 make an important contribution to terrestrial temperatures. Thus, for example, Chen and Tung (2018) proposed that changes in the Atlantic Meridional Overturning Circulation (AMOC) can affect global temperatures.
“Our results, based on several independent indices, show that AMOC changes since the 1940s are best explained by multidecadal variability, rather than an anthropogenically forced trend.” However, IPCC2013 (SPM-12) states that, “It is extremely likely that more than half of the observed increase in the global average surface temperature from 1951 to 2010 was caused by the anthropogenic increase in greenhouse gas concentrations and other anthropogenic forcings together.”
Unfortunately, this statement is an opinion based on unvalidated climate models.
Furthermore, even if that statement were verifiable, it is too broad to be of any use in deciding what must be done. A 90% effect would signal the need for drastic changes in life style for all developed countries and constrained development in the others, while at 55%, adaptation rather than mitigation should be sufficient. If we want to make rational choices between investments in adaptation and mitigation, the priorities for future investigations should be a better understanding of the natural contributions to climate change, as well as the effects of human changes in land use and the feed-back mechanisms mentioned below.
3. BACKWARMING BY ATMOSPHERIC CO2, THE ARRHENIUS EFFECT.
At atmospheric pressures, the well studied spectrum of CO2 has some infrared bands that absorb sunlight reradiated from the earth’s surface. The much-less-abundant CH4, N2O and some CFC’s also contribute some absorption bands, but the dominant absorber is water vapour. Note how quickly a desert site cools at night compared with a humid location. The heating of our atmosphere and then the earth’s surface by these absorbers is not in question. The issue is how much that heating can be affected by positive feedback processes such as the extra absorption caused by the increase in water-vapour present in warmer air and the negative feedback due to the reflectivity of additional clouds. Aerosols that reflect, absorb and scatter radiation and influence cloud formation also could produce a negative feedback while carbon soot would have a positive effect.
Thus, the Charney Report (1979) estimated an Equilibrium Climate Sensitivity (ECS) between 1.5 and 4.5 degrees C for a doubling of the CO2 concentration once equilibrium occurs. After 34 years of abundant research money and dozens of computer models, the latest report, IPCC2013, proposed the same unhelpful range of 3 degrees and added the comment “No best estimate for equilibrium climate sensitivity can now be given because of a lack of agreement on values across assessed lines of evidence”, which means that we do not even know the probability distribution. A temperature increase near 1.5 degrees for a doubling of CO2 should be manageable with adaptation technologies while 4.5 degrees would imply that major efforts in mitigation are needed.
The broad IPCC estimate is an output of climate models – the same models mentioned above that lack validation because we do not know the calibration details. Since climate models must include the whole earth, the fastest computers still require averaging over grids of about 102 x 102 km2 on the earth’s surface and 1 km in altitude. Consequently, much of the basic physics that occurs on smaller scales is represented by a multitude of parameters that must be tuned (calibrated) by fitting the model to observed phenomena. If the steep temperature rise from 1975 to 2001 in Fig 1 affected the tuning, there could be a warm bias, so empirical methods are preferable. Thus, Lewis and Curry (2018) determined an ECS of 1.50 K (5%–95% range: 1.05–2.45 K) by comparing global temperatures during the interval 2007 to 2016 with the interval 1869 to 1882 and the corresponding concentrations of CO2.
4. CLIMATE MODELS
Numerical models that provide useful weather predictions for some 10 days ahead are an outstanding achievement representing the three phases of water in the earth’s atmosphere interacting with local geography, all warmed by the sun during the day and radiating to space at night. These weather models are validated by comparing predictions with actual happenings and benefit from continuing revisions when the predictions fail. Climate models are an extension of these weather models, but the long-term nature of climate makes such comparisons with reality much more difficult. Where they have occurred, the results from the models have not been very supportive, as in Fig. 3, copied from the 2013 IPCC Report. This pattern of the climate models predicting higher temperatures than observed has continued with later temperature data if one discounts the natural 2016 El Nino warming of the Pacific Ocean.

Fig. 3. Model predictions and temperature observations from IPCC2013 (Fig. 11.9). Beginning in 2006, RCP 4.5 (Representative Concentration Pathway 4.5) labels a set of models for a modest rise in anthropogenic backwarming gases corresponding to an increase of 4.5 Wm-2 or 1.3% of the total solar flux integrated over all wavelengths.
In addition to this comparison with the observations, the authors of the chapter on climate models in the IPCC2013 report give many reasons to question the reliability of climate models. Thus IPCC2013 (p 9-10) states,
“Model tuning aims to match observed climate system behaviour and so is connected to judgments as to what constitutes a skillful representation of the Earth’s climate. For instance, maintaining the global-mean top-of the-atmosphere energy balance in a simulation of pre-industrial climate is essential to prevent the climate system from drifting to an unrealistic state. The models used in this report almost universally contain adjustments to parameters in their treatment of clouds to fulfill this important constraint of the climate system.”
Further, on calibrating the parameters, IPCC2013 (p 7-14) states
“The simulation of clouds in modern climate models involves several parameterizations that must work in unison. These include parameterization of turbulence, cumulus convection, microphysical processes, radiative transfer, and the resulting cloud amount (including the vertical overlap between different grid levels), as well as subgrid-scale transport of aerosol and chemical species. The system of parameterizations must balance simplicity, realism, computational stability and efficiency. Many cloud processes are unrealistic in current GCMs, and as such their cloud response to climate change remains uncertain.”
Furthermore, referring to multimodel ensembles (MME), IPCC2013 (p 9-17) states,
“the sample size of MME’s is small, and is confounded because some climate models have been developed by sharing model components leading to shared biases. Thus, MME members cannot be treated as purely independent.”
The following page (IPCC2013 p 9-18) continues with
“As a result, collections such as the CMIP5 MME cannot be considered a random sample of independent models. This complexity creates challenges for how best to make quantitative inferences of future climate.”.
The absence of adequate documentation, identified by Voosen (2016) in Section 1 above, already was noted in IPCC2013 (p 9-10),
“With very few exceptions modeling centres do not routinely describe in detail how they tune their models. Therefore, the complete list of observational constraints toward which a particular model is tuned is generally not available.”
and
“It has been shown for at least one model that the tuning process does not necessarily lead to a single, unique set of parameters for a given model, but that different combinations of parameters can yield equally plausible models.”
Chapter 9 of IPCC2013 also references in multiple places an important paper by Knutti et al. (2010), who discuss the combination of projections from multiple climate models and state in their abstract,
“Among these challenges are that the number of models in these ensembles is usually small, their distribution in the model or parameter space is unclear, and that extreme behaviour is often not sampled.”
Climate models can be very useful to help understand various physical processes and identify which are the most important, but it is premature to use them for reliable estimates of the relative importance of natural and anthropogenic contributions to climate change or to predict quantitatively the consequences of additional CO2 in our atmosphere. It is regrettable that these serious issues about the reliability of climate models are not repeated in the IPCC Summary for Policy Makers.
5. BENEFITS OF A WARMING PLANET AND INCREASING CO2.
All the concerns about climate change are based on the often-unstated premise that the mean global temperature and its distribution were optimum just prior to the industrial revolution and we must do everything possible to limit any increase of more than 2 degrees C and preferably no more than 1.5 degrees. Climatologists tell us that our production of CO2 already has used up about a degree of that warming. Yet, we have coped well with that increase and have welcomed the benefits of industrialization. Why should any increase of more than another degree be so serious? We do know that more people die each year due to excess cold than to excess heat (Gasparrini et al. 2015).
Also, as expected for a warming climate and increasing CO2 concentration, the world is becoming greener. From satellite observations of the leaf-area index for the years 1982-2009, Zhu et al (2016) found greening over 25 to 50% of the global vegetated area compared with decreases on less than 4%. Their ecosystem models indicate that CO2 fertilization can account for 70% of the greening.
Even though there is much uncertainty about the quantitative effect of CO2 and similar atmospheric gases on global temperatures, we need a rational discussion comparing the benefits and dangers of more CO2 and rising temperatures and what are acceptable limits. A key part of that that discussion should be the extent that developed countries must lower their living standards and how much developing countries must forgo improvements to achieve these limits.
6. OTHER ECOLOGICAL AND HEALTH PROBLEMS.
Anyone who claims that climate change is the most serious threat to the Earth is stating an opinion with no scientific basis and is diverting attention from other important ecological and health problems. Surely, providing adequate fresh water and food for everyone deserves more attention than the uncertain human contributions to climate change. Where does basic medical care for the developing world come in our list of priorities? The prevalence of AIDS remains a significant challenge in Sub-Sahara Africa. Furthermore, according to the Economist (2018 June 2-8, p. 54) malaria kills 400 000 people a year. Should eradicating malaria be less important for the affected countries than reducing the generation of CO2? What about excess fishing of the oceans or all the pollution from non-degradable plastic waste? In areas prone to earthquake, should strengthening buildings have priority over climate-related projects? We do not have the resources to deal with all these challenges. Choices are required.
Most developed countries allocate significant funds in foreign aid to help address many of the above problems. However, now there is the risk that governments will divert some of this money to fulfill commitments to the 2016 Paris Climate Agreement. Whatever our view of the dangers of CO2, we must give serious attention to the other challenges to health and ecology.
7. FAMILY SIZE.
More people inevitably result in more generation of CO2 and more use of all of our Earth’s resources, whether fresh water or scarce minerals. The absence of a person is a much more effective way to reduce CO2 than any life-style change when that person joins the adult population. One does not want to consider forced population control as was the case in China from 1979 to 2016, but rather to note the effects of increasing opportunities for women outside the home in developed countries. Birthrates have fallen, often seriously, below the stable number of 2.1 babies for each woman, while countries such as Nigeria have 5.4 births per woman according to the Economist (2018 Jul 21, p. 35).
Thus, in developing countries where the birthrate exceeds about 2 per woman, the priorities should be to educate women and generally enhance prosperity so that women see alternatives to large families. The use of the cheapest fossil fuels, even coal, to increase the availability of electricity that would ease many tedious tasks, could in the long term more than offset the CO2 generated. Fewer grandchildren will ease the task of saving the planet.
8. UNINTERRUPTABLE AND INEXPENSIVE ELECTRICITY.
Life in developed countries has become totally dependant on uninterruptible electricity. Loss for an instant can reset critical controllers, loss for hour can leave people stranded in trains and elevators and loss for a day can spoil food in refrigerators and confound industrial processes. These risks become much more likely when wind and solar sources become too large a fraction (more than about 20 to 30%) of the electricity supply. In the case of Sweden, a Reuters report of 2018 Jul 2 stated,
“Sweden will have to import more electricity during winter as the country, a net power exporter to the rest of Europe, shifts from nuclear to wind, its grid operator said. Last winter, the first since the closure of its Oskarshamn 1 reactor, stretched Sweden’s resources as peak consumption rose by 800 megawatt (MW), triggering start-up procedures in its reserve energy plants. Sweden’s power balance will deteriorate further from next winter when the country will need imports and the situation will become worse with two more of its reactors closing by 2020, state-grid Svenska Kraftnat (SVK) said in a report on Monday.”
There is much talk about renewable sources displacing fossil fuels for all electricity generation, if not for all energy needs, but proper engineering analyses tell us this is not possible with existing technology if we require an uninterruptable supply for extended intervals. As an example, Andrews (2017) compared actual daily average wind and solar generation in the Texas grid for the three years 2010 – 2112 with the actual demand. Then he calculated what storage would be needed if the renewables were increased to match the average demand and the surpluses, mainly in the spring and fall, were used to compensate for the shortfalls that occurred during the winter and late summer. He concluded that to match the demand on all occasions with batteries would require storage of 5×10¹³ Watt hours corresponding to 4×10⁷ times the 1.3×10⁶ Watt-hour battery system that Neoen-Tesla has installed in South Australia. For California, the storage problem became real on 2018 Sep. 10 when the governor signed legislation committing the state to generate 50% of its electricity from renewable sources by the year 2025, 60% by 2030 and 100% by 2045 while planning to close its last nuclear generator, Diablo Canyon, by 2025. Further ignoring engineering realities, the governor also signed an executive order requiring the total CO2 emissions to be negative after 2045 (http://euanmearns.com/california-goes-carbon-negative/#more-22547 ).
An alternative scheme for storage is to pump water to a high elevation when excess energy is available. Then when renewables are not producing, the head of water can generate electricity. However, it is difficult to find sites with sufficient volumes and altitude differences. For example, the large Coire Glas water storage system being constructed in Scotland with a capacity of 30 GWh (Mearns 2013) represents only 2 seconds of the United Kingdom peak electricity consumption of 5×10¹⁰ GW. The modest capacity provided by the South Australia battery or pumped water in Scotland could cover brief intervals of no sun or wind, but not extended calms when the sun is unavailable.
Some electricity grids hope to cope with gaps in renewable generation by increasing the price of electricity when the supply is limited to encourage non-essential users to wait, but in one study Andrews (2018) concluded that electricity demand is relatively insensitive to price and that higher electricity rates will not achieve significant demand reductions unless raised to levels where many people are no longer able to pay their electricity bills. Another approach is to continue to burn fossil fuels for electricity, but then capture and store the CO2. Suitable processes are feasible on a small scale, but none are yet practical on the necessary industrial scale (Andrews 2016). Thus, a common solution is stand-by generators powered by natural gas, but in this on-off mode they are much less efficient, so some of the saving in CO2 is lost and the users have the capital and operating costs of duplicate fossil-fuel generating systems and their connections to the grid. Thus, we can understand why, in most locations, electricity prices continue to rise while the costs of solar cells and windmills are falling (Shellenberger 2018).
If we want uninterruptable electricity without burning fossil fuels, we must recognize the only practical large-scale alternatives are hydro and nuclear generation. Since most of the world’s suitable hydro sites already are developed unless we wish to destroy more river valleys of natural beauty, hydro power will not contribute much more to the world’s energy resources, and always is at risk from droughts. Nuclear fission is the remaining option. It is not cheap, but it provides the essential continuous base for a reliable energy system without producing CO2. Climatologist James Hansen (2017), consistent with his concern about the effects of CO2, explained his support for nuclear electricity,
“The people who argue for all renewables think that – well if we can go from 0% to 10% to 20% renewable then we’re on the way and then it will get easier and we’ll get 100%. Well it’s actually, if you look at the engineering, it’s actually the opposite. When you get to 20 or 30%, then it gets harder! Not easier! …because of the intermittency of the renewables. We have to phase out carbon emissions at a rate of several percent a year. I don’t see any way we can do that without the help of nuclear power. Nuclear power is essentially carbon-free energy”
Electric vehicles can have many practical uses. However, if their primary purpose is to reduce the generation of CO2 from fossil fuels, this will happen only where the major source of the electricity is hydro or nuclear. The limited storage capacity of electric vehicles often will require charging when the wind is not blowing and the sun not shining. Also, one must ask how many charging cycles are possible before the process becomes inefficient and the battery must be replaced and how much fossil fuels and scarce materials have been used in the manufacture of the battery.
9. BIOFUELS
The requirement in many jurisdictions that automobile fuel contain a certain percentage of alcohol derived from crops is often justified as a way to reduce CO2 generated by road transport because regrowth absorbs the CO2, but the enthusiastic proposers never thought through all the consequences. Past advocates such as Al Gore now admit it was a faulty scheme (Kolawole 2010), but the profits to corn farmers have generated such a strong support in American states like Iowa that few politicians have the courage to challenge the policy. Not only does the generation of the alcohol from corn produce more CO2 than it saves, it also diverts the crops from feeding people. (Lomberg 2013).
Similarly, the production of palm oil for biofuels is transforming more and more natural tropical rain forest to cultivated rows of palm trees, thus constraining the habitat of many species, particularly the orangutan (http://savetheorangutan.org/about-orangutans/habitat ) Furthermore, the use of tropical peatlands for palm trees releases large quantities of stored CO2 (Watts 2011).
Wood chips from temperate forests are another popular biofuel. As reported by Montague (2018), chips from trees harvested from the south-east United States are shipped to northern England for burning in the Drax thermo-electric plant because the rules of the European Union classify wood chips as a renewable resource earning a tax advantage, even though the benefits in reduced atmospheric CO2 take the many-decade life of a tree to arrive.
10. SEA LEVEL
Many island communities and many coastal cities worry about the effects of rising ocean levels, so like global temperature it is important to separate anthropogenic effects from the natural contributions before assigning any blame. Tide gauges (http://www.psmsl.org/data/obtaining/map.html ), which reference changes in sea level to adjacent land, provide the only long-term measurements, but they can be compromised by instrument updates, location changes, variations in ocean currents and land rise or subsidence. Also, there were very few tide gauges outside of Europe prior to 1900. Fig. 4 is Bitterman’s (2015) plot of seven analyses of the tide-gauge data and Fig. 5 his plots of the rate of change since 1870 showing large fluctuations. The 1940-1950 peak rate occurred before the recent acceleration in the concentration of atmospheric CO2, so the cause of the latest rate increase remains uncertain. In her review of the literature, Curry (2018a) concluded,
“There is substantial multi-decadal internal variability in the sea level change record, including an apparent ~60-year oscillation. This variability confounds analyses of sea level rise acceleration and attribution to human caused climate change. In view of the multiple modes and periods of internal variability in the ocean, it is likely that we have not detected the full scale of internal variability effects on regional and global sea level change.”

Fig. 4. The sea-level anomaly from various methods and the satellite data since 1992 as plotted by Bitterman (2015).

Fig. 5. Rates of sea-level rise calculated by Bitterman (2015) from Fig. 4 by smoothing with a filter of half-width of 15 years and then differentiating
Beginning in 1993 satellite observations also have provided sea-level information, but the complex corrections add much uncertainty. Curry (2018b) discussed these and concluded:
“In my opinion, the value of the altimeter data is in understanding regional and interannual variability, and that the first 6 years of altimeter data should be pretty much ignored in climate change arguments. In any event, the altimeter data set is not useful by itself (owing to its short length) for detecting long-term accelerations that could be attributed to human-caused climate change.”
Increasing global temperatures are expected to raise sea levels through the thermal expansion of ocean waters and the melting of polar ice, but it is premature to conclude that human activity has had any effect yet on rising sea levels.
Nevertheless, many locations are at risk from the natural effects, particularly storm surges. Protecting existing human habitation and valuable real estate with sea walls and strongly discouraging further development in such areas should have high priorities in any climate-action policies and funding. Even if the IPCC predictions of a human-caused rise of 0.3 to 0.6 m by 2100 were valid, this is insignificant compared with storm surges of multiple meters.
Mid-ocean atolls are in a special situation. As Darwin (1838) recognized, atolls are not submerged by rising sea level, they are dynamic structures that rise with it. See, for example, the Tuvalu study by Kench et al. (2015) “There is no evidence of heightened erosion over the past half-century as sea-level rise accelerated. Reef islands in Funafuti continually adjust their size, shape, and position in response to variations in boundary conditions, including storms, sediment supply, as well as sea level.” Eschenbach (2010) has summarized the situation with atolls and recommended that their residents
– recognize there are limits on the population and tourism an atoll can support,
– conserve fresh water to maintain the central reservoir that floats above the denser salt water,
– prohibit the catching of parrot fish and all other beaked fish that help build the reefs,
– minimize the use of coral sand to construct buildings, roads and airports and collect it from dead zones,
– reduce the loss of coral sand by constraining the flow patterns of wind and water.
To this I can add my own comment – stop claiming reparations from developed countries for a naturally rising sea level.
11. CONCLUSIONS.
If our goal is to save the planet for our grandchildren, we must be not burden them with the repayment of debt incurred installing renewable energy sources when we are unwilling to spend the money now. For example, when the citizens of Canada’s Province of Ontario objected to the high electricity costs due to favourable contracts for renewable sources, the recently defeated government borrowed money to reduce the present rates. If we want dependable electricity without producing CO2, we should invest in more nuclear generation.
Furthermore, until we have more certainty in the relative importance of natural and human contributions to rising global temperatures, we should prioritize adaptation over mitigation. Otherwise we could waste much effort and resources trying to limit a temperature rise over which we have limited control while neglecting places where early adaptation could be useful.
12. FINAL COMMENT.
Every scientist, regardless of his or her own conclusions about the relative importance of natural and human contributions to present climate change, has the duty to challenge all unscientific statements and practices about the subject. Otherwise, as discrepancies continue to accumulate, the whole scientific enterprise, far beyond just climate change, is at risk of being rejected by the rest of the population.
LINK to PDF of complete essay: ClimateEssay

~~~~
[1] Report cover turbulent image: By C. Fukushima and J. Westerweel, Technical University of Delft, The Netherlands – Own work, CC BY 3.0, https://commons.wikimedia.org/w/index.php?curid=3082535 Flow visualization of a turbulent jet, made by laser-induced fluorescence. The jet exhibits a wide range of length scales, an important characteristic of turbulent flows. Cover clouds and sun a screenshot from video footage licensed from Shutterstock.
Thanks Mr. Morton for sharing and making your comprehensive work publicly accessible, best regards from Copenhagen, Heine Stromdahl, math teacher – mostly in primary school but also in High School.
Phil Jones quote: “…We have 25 or so years invested in the work. Why should I make the data available to you, when your aim is to try to find something wrong with it…”
This quote is so wildly anti-science that I can’t believe that Dr. Jones wasn’t fired immediately after it was revealed.
Your final paragraph regarding the growing discrepancies leading to rejection is very true and may already be happening. Perhaps it is just like a fuse burning out when overloaded as a protective action.
The Province of Ontario mentioned in your report is an example of what happens when politicians also do not question science and the setting of unattainable goals, but join bandwagons in an effort to gain votes by being “part of the team”. Eventually there is massive rejection at the polls. Errant and expensive policies scrapped. Other Canadian provinces are now rejecting carbon taxing.
The USA has also started to backtrack and other countries are gradually seeing the folly of the Paris Accord.
For some reason the page is very slow to load, and I can’t view the images.
“… Otherwise, as discrepancies continue to accumulate, the whole scientific enterprise, far beyond just climate change, is at risk of being rejected by the rest of the population. …” Actually, rejection of science has long been growing, even among many scientists.
The very positive side is that much of the real criticism, and often the best analysis and new ideas, are coming from amateurs fed by access to data and more [publicly available, free] papers on the web. Advanced data analysis, natural quasi-cycles, electrical effects, and better context, are manifest in [fundamental theoretical physics (potential replacements for General Relativity & Quantum mechanics), chemistry (very interesting and effective models of the structure of electrons, protons, atoms, molecules), geology(observation-based explications for anomalies), etc. Climate science was an easy target because of its wacko nature, and easy observation of mainstream scientific failures as the norm.
When mainstream science picks up on these amateur ideas, of course the credit goes to the “first big [name, funded] institution” that publishes, but those who are tracking the issues know that’s not where it came from. The overall impact is quite positive, and to me it marks a transition towards a much better science.
I’m not sure that industry science, long treated with disrespect, is doing well. Perhaps “free” university research resources are a disincentive for corporate investments, as are declining competitiveness and the drag of [lawsuits, regulations, anti-development and anti-business attitudes]. That may be a serious long-term issue, but in the end industry science will likely do well in the fast-growing economies of the world.
Excellent article! I hope the Al Gores and Andrew Weavers of the world read it……