André Bijkerk has for many years been active in the Dutch climate sceptic world and as moderator of the Yahoo ClimateSceptics Forum. His specialty has been in Holocene paleoclimate with its geological and paleobotanical aspects. The present post originally appeared in Dutch on Hans Labohm’s blog climategate.nl (September 9th 2017)
DUTCH Version:
http://climategate.nl/2017/09/09/andre-bijkerk/
CLIMATES OF TIMES PAST
by André Bijkerk
Considering the likelihood of future presentations and discussions, an update of paleoclimatological information was overdue. I was amazed to bump into a full overview of the atmospheric CO2 content of the last 420 million years published much earlier this year. An important milestone in the history of climate on Earth.
What is the big picture? Paleoclimate researchers have been struggling with the faint young sun paradox for a long time now. Over its lifetime the sun is thought to increase its energy radiation gradually, in the order of magnitude of 10% per billion years. That means that the sun must have been a few percent less intense a few hundred million years ago. To be precise, 420 million years ago, it was about 50 W / m2 at approximately 1370 W / m2 of solar radiation according to the authors. Ergo, at that time the earth should commonly have been somewhat colder than now.
However, many rocks and fossils from the long elapsed era suggest that the earth has been much warmer at times than is the case now. This can not reasonably have been caused by a weaker sun and so there had to be something else that made it possible and obviously, this would allegedly be greenhouse effect. If that is true, it must also be possible to find a correlation between the reconstructed temperatures and concentrations of greenhouse gases, mainly CO2; this study deals with the latter. Previously, the record was only rather coarse, with many more gaps and unsuitable for the support of the greenhouse’s hypothesis. But now we have this:

Source: Foster et al., 2017 Nature doi: 10.1038 / ncomms14845.
The blue line is the statistical average value of the various reconstruction plots for CO2. The red line shows its linear regression (curved because of the logarithmic scale). Based on this image, the authors argue that they are seeing a balance between the gradual decrease in CO2 concentration due to the ever-increasing intensity of solar radiation. If in the distant past, CO2 has indeed been able to increase the temperature to compensate for the weak sun, this would mean a significant climate sensitivity for CO2 doubling, and therefore they warn once more for the so-called thermageddon scenarios.
But is that correct and can we check it? What we miss here is a detailed reconstruction of the temperature. We only see a coarse subdivision in the so-called greenhouses and icehouses in the black and white bar above the chart, with the blue indication of the lowest latitude reached by ice. This suggests a coarse correlation, but we must remember that the greenhouse gas should be linked directly to temperature as an interacting mechanism. Hence you can not tolerate millions of years in between.
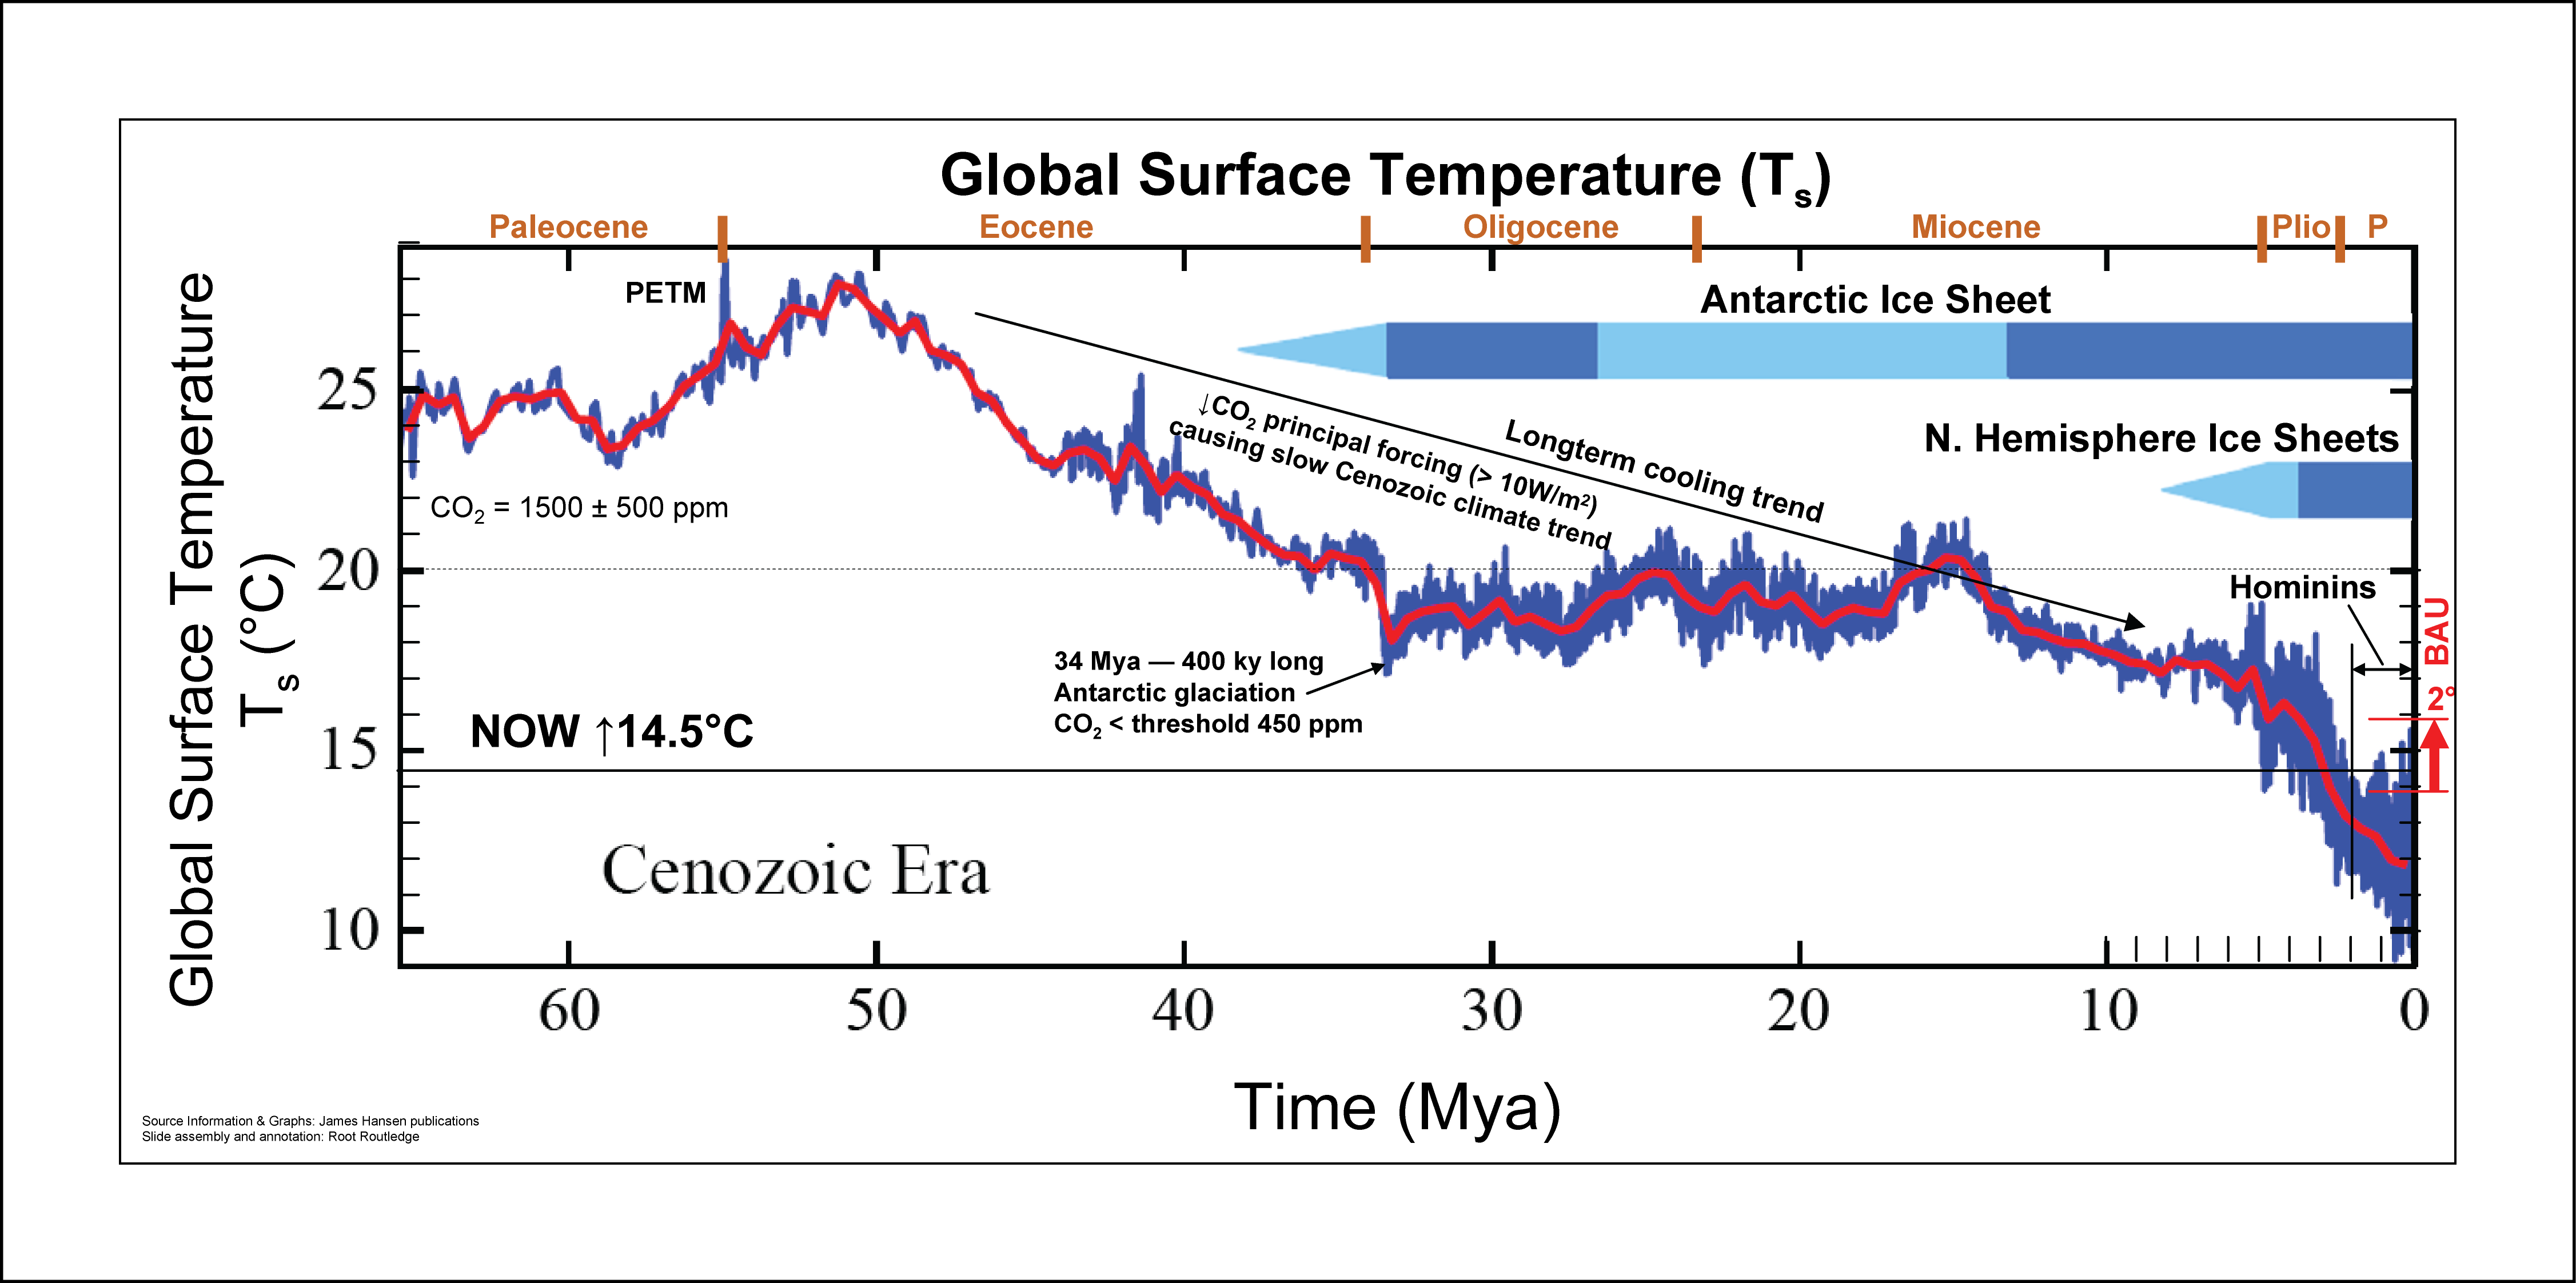
So if we really want to test this hypothesis, we need a more accurate temperature construction. This does not exist for the entire 420 million year, but we have detailed ‘proxy’ reconstructions for the last 65 million years, the Cenozoic era, and a recent one provided by Zachos et al 2008. It also seems long enough to be able to judge whether the CO2 and the climate are indeed even remotely correlated, certainly in comparison with the current disputes about a few hundredth of a degree per decennium.
However, finding the original data proved to be difficult, so I digitized the well-detailed graph itself. The resulting error is less than one percent, not enough for rocket science, but fine for finding correlations. This then produces the red curve in this graph:

Figure 1. Horizontal X-axis in millions of years, 0 is present, Vertical Y-axis on the left is CO2 content in ppm, according to Foster et al 2017; plotted with different types of ‘proxies’ directly from their ‘supplemental data’; The scale is logarithmic, for a better comparison. To avoid clutter, data from the last million years have been omitted. The blue curve is again plotted as the statistically significant average value (LOESS fit) Secondary Y-axis at the right right is for the proxy-modeled average temperature reconstruction of the Earth. This is the red curve.
The question now is to what extent the red line of temperature reconstruction correlates with the blue line of CO2 reconstruction. We can see that in Figure 2. Here we have transformed the values of the LOES fit to their natural logarithm, again for better comparison, since the relation between concentration of greenhouse gas and its absorption is considered to be logarithmic
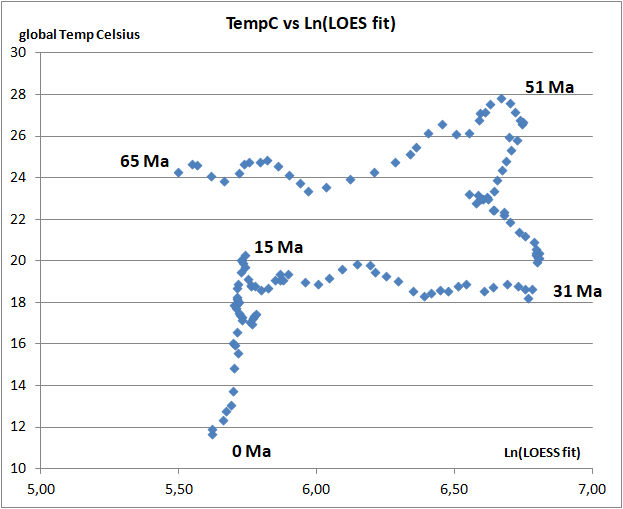
Figure 2. The comparison of temperature and CO2 reconstructions throughout the Cenozoic in half-million-year steps: The horizontal X axis is the logarithm of the concentration of CO2 in ppm and the vertical Y axis shows the temperature reconstruction in degrees Celsius.
The caveat is that the plots are still very coarse and each one may misrepresent the average value of their time frame. However with several plots generally concurring, the confidence about the accuracy is not at its lowest. Normally, you would expect a curve or a more or less straight line without square corners so that every value on the x-axis has a unique value on the y-axis. Here in this case, however, we observe CO2 around 300 ppm at global temperatures between 12 and 20 degrees Celsius in the period 0-15Ma, or 24-25 degrees with the same concentration around 60 million years ago. Also, it can be stable 18-20 degrees Celsius with the CO2 concentration decreasing from some 850 ppm around 31 million years ago to around 300 ppm around 15 million years ago.
Again, these reconstructions are too coarse for precise conclusions but it is obvious that they most certainly do not support the notion that CO2 was a (the most) dominant forcing of the temperature in the Cenozoic. Especially the early period, the Paleocene, from 65-55 million years ago had comparable CO2 levels than today but was more than ten degrees warmer. But if it wasn’t CO2, then what was it?
Shifting of continents is not a good explanation, since the temperature reconstruction is based on proxies of the ocean. Maybe that Nikolov and Zeller can offer another explanation, with their hypothesis about planetary temperature dependance on surface pressure. So, how about an atmosphere with a slightly higher pressure at ground level, like for instance 1200 hPa at the surface, rather than 1013 hPa. This could happen due to differences in the balance of the oxygen and nitrogen cycles between the atmosphere, ocean and biota. This would also better explain how giant dragonflies could exist and how dinosaurs learned to fly. But it also might have caused a prolonged vertical temperature gradient or lapse rate, easily to more than 10 degrees above current surface temperature.
Hence, it’s not that we need CO2 to explain a much warmer past.
~~~~
Dutch Version:
An overview of Nikolov and Zeller:
Our analysis revealed that GMATs of rocky planets with tangible atmospheres and a negligible geothermal surface heating can accurately be predicted over a broad range of conditions using only two forcing variables: top-of-the-atmosphere solar irradiance and total surface atmospheric pressure. The hereto discovered interplanetary pressure-temperature relationship is shown to be statistically robust while describing a smooth physical continuum without climatic tipping points.
This continuum fully explains the recently discovered 90 K thermal effect of Earth’s atmosphere. The new model displays characteristics of an emergent macro-level thermodynamic relationship heretofore unbeknown to science that has important theoretical implications. A key entailment from the model is that the atmospheric ‘greenhouse effect’ currently viewed as a radiative phenomenon is in fact an adiabatic (pressure-induced) thermal enhancement analogous to compression heating and independent of atmospheric composition.
https://rclutz.wordpress.com/2017/07/11/planetary-warming-back-to-basics/